 Pulseri

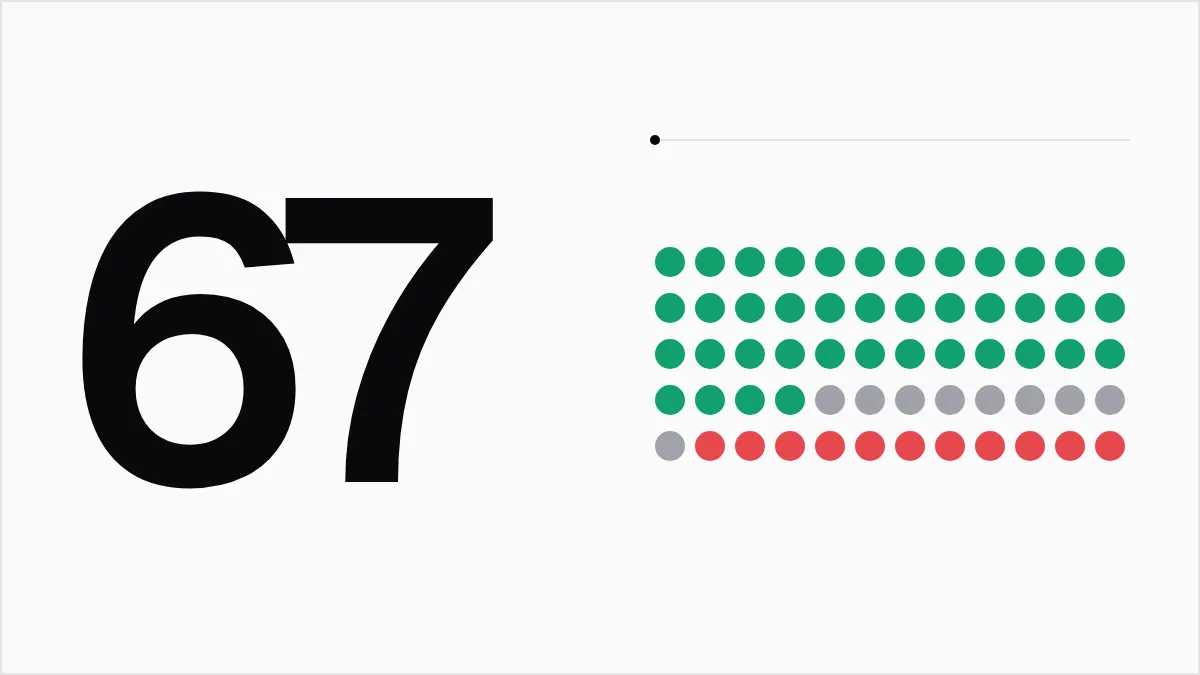
Your customer satisfaction score (CSAT) is the share of people who rated one moment 4 or 5 out of 5. Divide the number of satisfied answers by all answers and multiply by 100. The rest of this post covers the choices that move the result: the scale, who answers, and how many answers you have.
The CSAT glossary entry gives the short definition. This is the longer guide.
How to calculate your customer satisfaction score
The usual formula counts the satisfied answers, divides by the total number of answers and multiplies by 100. 1 On a 1 to 5 scale, a 4 or a 5 counts as satisfied, a 3 is neutral, and a 1 or a 2 is dissatisfied. 2
Made-up example: you ask 60 people to rate a support chat from 1 to 5.
| Rating | Answers |
|---|---|
| 5 | 21 |
| 4 | 19 |
| 3 | 9 |
| 2 | 7 |
| 1 | 4 |
| Total | 60 |
Satisfied answers are 21 plus 19, which is 40. Divide 40 by 60 and multiply by 100. Your CSAT is 67 percent.
You can also work out the average rating: (21 × 5 + 19 × 4 + 9 × 3 + 7 × 2 + 4 × 1) divided by 60 is 226 divided by 60, about 3.8. Both numbers describe the same 60 answers, but they are not interchangeable. Pick one and report it the same way every time.
To check your own numbers, use the free CSAT calculator.
The same answers on other scales
CSAT has no single scale. Zendesk shows a 5 point version and a 10 point version, where the 10 point version groups answers in pairs: 9 to 10, 7 to 8, 5 to 6, 3 to 4 and 1 to 2. 2 The cut between satisfied and not satisfied is yours to set, and it can move the score a lot.
Made-up example: 60 people rate a setup call from 1 to 10.
| Rating | Answers |
|---|---|
| 10 | 12 |
| 9 | 13 |
| 8 | 11 |
| 7 | 9 |
| 6 | 5 |
| 5 | 4 |
| 4 | 3 |
| 1 to 3 | 3 |
The same 60 answers give three different CSAT figures:
| Satisfied means | Satisfied answers | CSAT |
|---|---|---|
| 9 and 10 | 25 | 42 percent |
| 8 to 10 | 36 | 60 percent |
| 7 to 10 | 45 | 75 percent |
Nothing about the customers changed between the rows, only the definition. Write down which answers count as satisfied before you send the survey. Keep the scale, the wording and that cut the same from one survey to the next. Compare scores only with scores that used the same ones.
If you are starting from scratch, the 1 to 5 scale is the simplest, because people understand it at a glance and the satisfied group is easy to name. You can copy a set of CSAT survey questions that uses it.
What counts as a good score
Guides disagree. Zendesk says many industries treat 75 to 85 percent as good and above 90 percent as exemplary. 2 Medallia puts 90 to 100 as excellent, 70 to 89 as good, 50 to 69 as average and below 50 as poor. 1 Neither page names a source for its bands, so treat them as rules of thumb.
The 67 percent from the first example is "average" in Medallia's bands and below "good" in Zendesk's. That tells you little by itself. A better test is your own trend: is the score rising for the same kind of moment? A support chat and a first-week setup are different moments, so score them separately.
Who answers changes the number
Your score covers the people who answered, not everyone you asked. If unhappy customers skip the survey more often than happy ones, the score runs high.
Made-up example: you send a survey to 100 customers after a ticket closes. 40 answer, and 34 of them give a 4 or a 5. Your CSAT is 85 percent. Suppose the 60 who stayed quiet would have been satisfied only half the time. Across all 100, 64 would be satisfied, and the score would be 64 percent. You cannot know the real figure, but you can see how far apart the two could be.
Two things help. Ask right after the moment, when people still remember it. And read the comments on low scores, because that is where the unhappy ones tell you what happened.
How many answers you need
A CSAT percentage from a few answers jumps around. The margin of error tells you how far the true figure could sit from yours. For a share of people, divide p times (1 minus p) by n, take the square root, then multiply by z. Here p is your share as a decimal, n is the number of answers, and z is 1.96 for 95 percent confidence. 3 The formula also needs n times p and n times (1 minus p) to be at least 10, which is why the table starts at 50 answers.
This assumes the people who answered were chosen at random, which a survey of whoever chooses to reply is not. 3 Read the table as a best case.
Using the 67 percent from the first example, rounded to the nearest point:
| Answers | Margin of error (95 percent) |
|---|---|
| 50 | plus or minus 13 points |
| 100 | plus or minus 9 points |
| 400 | plus or minus 5 points |
With 50 answers, a CSAT of 67 percent could sit anywhere from about 54 to 80. A move of three points from one month to the next is noise at that size. Wait for a larger gap, or collect more answers, before you call it a change.
Ways to raise it that show up in the data
You can check each of these against your own numbers:
- Ask at the moment. Send CSAT right after a ticket closes or an order arrives. For the full plan, see how to run a customer satisfaction survey. Pulseri can send CSAT when a Zendesk ticket is solved.
- Read the 1s and 2s first. Put one open question after the rating, such as "What is the main reason for your score?"
- Reach the team the same day. An alert rule on a low score lets someone reply while the customer still cares. The Slack alert guide shows how to build one, using NPS detractors as its example.
- Fix one cause at a time. Group the low scores by reason. Fix the most common one, then look at the next survey.
CSAT sits next to the other two common scores. NPS, CSAT and CES compared explains when to use each.
Send CSAT with Pulseri
Pulseri's CSAT question is "How satisfied were you with your recent experience?" on a 1 to 5 scale, and the score is the share of 4s and 5s. It is part of customer feedback surveys alongside NPS and CES. See the pricing page for what each plan includes.
Sources
- CSAT scores, how to measure and improve the customer service experience (Medallia) (retrieved 4 Nov 2026) Back to text: 1, 2
- Customer satisfaction score (Zendesk) (retrieved 4 Nov 2026) Back to text: 1, 2, 3
- Margin of error guide and calculator (Qualtrics) (retrieved 4 Nov 2026) Back to text: 1, 2