 Pulseri

A customer satisfaction index (CSI) is one number, usually from 0 to 100, built from several satisfaction ratings and often weighted by how much each one matters. It differs from CSAT, which describes one moment, and from ACSI, a national study with its own method.
This guide shows the formula in three steps and a worked example with made-up numbers. It also covers how to choose weights and what not to claim from the result.
What a customer satisfaction index is
A CSI answers "how satisfied are customers across the whole experience?" in one figure. You ask about several parts of that experience, such as onboarding, support and billing, and combine the answers. Questback describes the same idea: separate attribute scores, with an overall index built from them. 3
People often mix up three different numbers.
| CSAT percent | Company CSI | ACSI | |
|---|---|---|---|
| Asks about | One moment | Several moments or attributes you choose | Three questions about one company, asked in a national study |
| Scale | Often 1 to 5 | Your rating scale, rescaled to 0 to 100 | 1 to 10, rescaled to 0 to 100 |
| Result | Share of 4s and 5s | Weighted or plain average of attribute scores | Weighted average, weights set by its own model |
For the single-moment score, see what CSAT is and use the CSAT calculator.
Where ACSI fits
The American Customer Satisfaction Index (ACSI) is a separate, published study. Its score is a weighted average of three survey questions, and its researchers estimate the weights with proprietary software. 1 You cannot reproduce its official weights, so a company index is not an ACSI score and should not be called one.
The rescale step is public in one place. A U.S. Department of Labor guidance letter (TEGL 36-10) tells state workforce agencies how to apply ACSI. It is state guidance that uses ACSI, not an ACSI publication. It converts a mean on a 1 to 10 scale by subtracting 1, dividing by 9 and multiplying by 100, so a mean of 8.3 becomes 81.1. 2 The letter then multiplies the three converted values by weights and says the weights it uses are for illustration. 2
The formula in three steps
- Rate each attribute. Ask customers to rate each part of the experience on one scale, such as 1 to 5. Take the mean for each attribute.
- Rescale each mean to 0 to 100. On a 1 to 5 scale the lowest answer is 1, so subtract 1 and divide by the range of 4: score = (mean - 1) / 4 x 100. For a 1 to 10 scale the divisor is 9, as in the Department of Labor example.
- Combine the scores. Multiply each score by its weight and add the results: CSI = (weight 1 x score 1) + (weight 2 x score 2) + ... The weights add up to 1. With equal weights this is a plain average.
Omniconvert gives the same pattern, with weights that add up to 1 and a 0 to 100 result. 4
A worked example (made up)
This example uses made-up numbers. A SaaS company with 40 customers asks each one to rate three moments from 1 (very dissatisfied) to 5 (very satisfied).
| Attribute | Mean rating | Rescaled score | Weight |
|---|---|---|---|
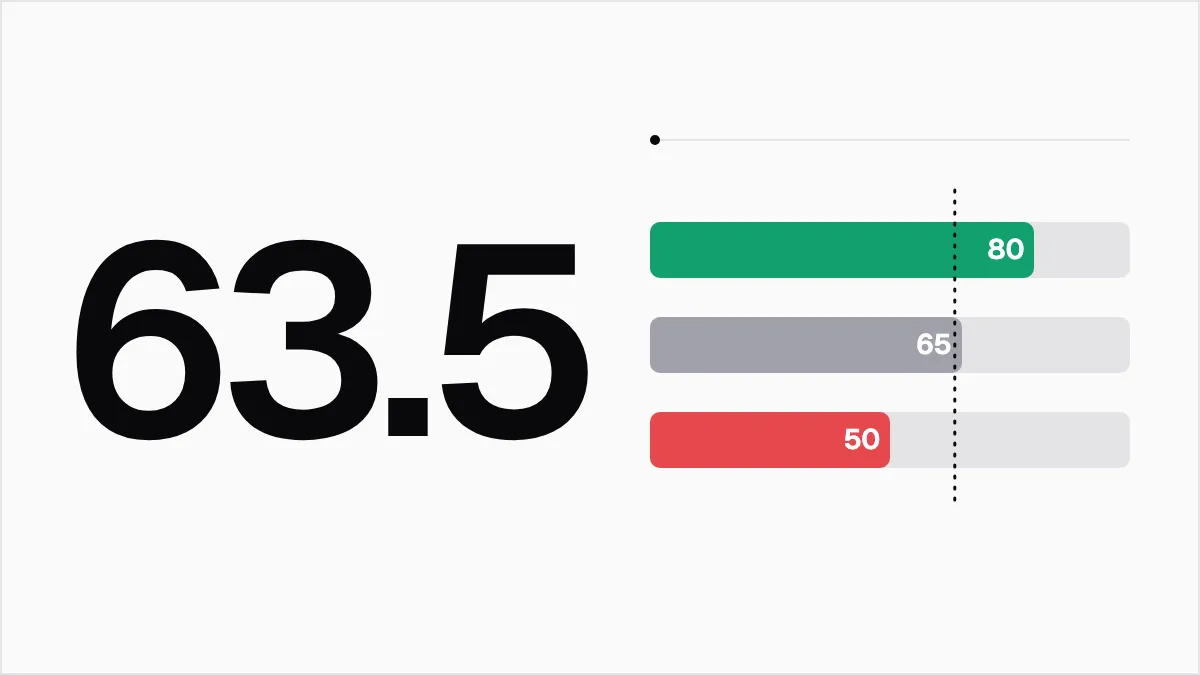
| Onboarding | 4.2 | (4.2 - 1) / 4 x 100 = 80 | 0.2 |
| Support | 3.6 | (3.6 - 1) / 4 x 100 = 65 | 0.5 |
| Billing | 3.0 | (3.0 - 1) / 4 x 100 = 50 | 0.3 |
Unweighted: (80 + 65 + 50) / 3 = 65.
Weighted: (0.2 x 80) + (0.5 x 65) + (0.3 x 50) = 16 + 32.5 + 15 = 63.5.
The two results differ by 1.5 points because the weights give more room to support and billing, the two lower scores. Neither number says which attribute to fix. The table does: billing scores 50 and onboarding scores 80. Report the index with this table beside it, never alone.
How to choose weights
Weights are a judgment, so write down how you chose them.
- Start with equal weights. They need no assumptions and are easy to explain.
- Move to unequal weights only with evidence. Good evidence is an importance question in the same survey, or a link between each attribute and something you can count, such as renewals. Questback describes both customer rankings and statistical methods for this. 3
- Never set weights to make the number look better. Fix them before you see the results and keep them fixed, or your trend line measures your weights instead of your customers.
- Wait for enough answers. Estimating them from data needs a sample large enough that the pattern is not noise. As a rule of thumb for a small company, wait for around 100 answers before you trust a weighting study.
How many answers you need
The index moves with every answer. In the example above, with 40 answers, one customer changing one rating by a single point moves that attribute's mean by 0.025 (1 divided by 40) and its rescaled score by 0.625 points. A shift of a point or two in the headline can be one person.
Look for changes that persist over several periods, and keep the same questions, scale and weights each time. If you change any of them, start a new trend line.
Collecting the ratings with fewer questions
Ask about each attribute right after its moment, not in one long survey. Ask about support when a ticket is solved, about onboarding after first setup and about billing after an invoice. Each answer is a CSAT-style rating on one moment, which you then combine yourself. Our CSAT question templates give wording to copy, and customer satisfaction survey questions to ask lists questions by moment.
Asking at the moment of the event keeps each survey short, but only if nobody is asked too often.
See NPS vs CSAT vs CES for how the single-moment scores differ.
How to read a CSI
- Read the parts first. The lowest attribute is where to act. The index is a summary.
- Compare with yourself. This guide gives no industry average because a CSI depends on your questions, scale and weights. ACSI figures belong to ACSI's own scale and sectors, and do not apply to yours.
- Add one open question. "What is the main reason for your score?" gives the reason behind a low attribute.
- Do not mix audiences or periods. Keep customers and employees apart, and keep the same attributes each quarter.
Where Pulseri fits
Pulseri sends CSAT surveys to the right person after an event, such as a solved ticket, and reports the CSAT percent for each survey. It does not compute a customer satisfaction index. To build one, take the per-survey CSAT results or your own rating means and apply the formula above in a spreadsheet. Work out the CSAT percent for each attribute with the calculator linked above, then see how customer feedback surveys collect those ratings.
Sources
- The Science of Customer Satisfaction (ACSI) (retrieved 5 Nov 2026) Back to text
- Training and Employment Guidance Letter 36-10 (U.S. Department of Labor) (retrieved 5 Nov 2026) Back to text: 1, 2
- CSI, the customer satisfaction index: the complete guide (Questback) (retrieved 5 Nov 2026) Back to text: 1, 2
- Customer Satisfaction Index (Omniconvert) (retrieved 5 Nov 2026) Back to text