 Pulseri

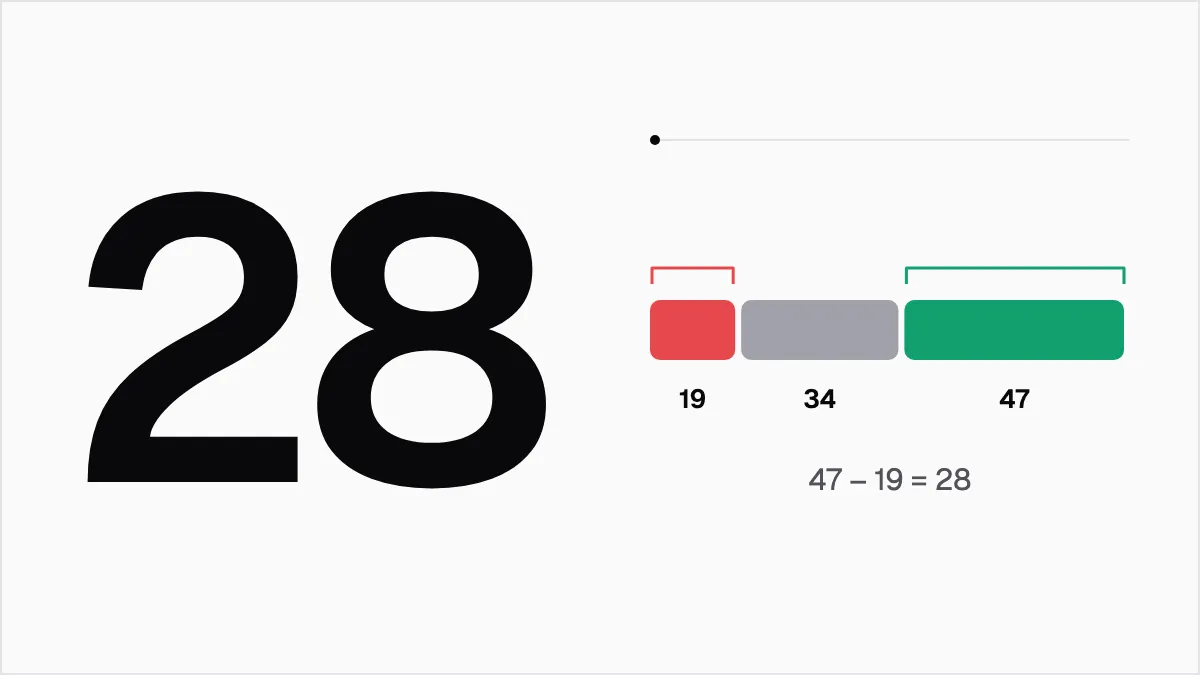
To calculate NPS, find the percentage of people who answered 9 or 10, find the percentage who answered 0 to 6, and subtract the second from the first. The result is a whole number between -100 and +100.
This guide walks through three examples with made-up numbers, shows how rounding works and covers a 1 to 5 scale.
To skip the arithmetic, use our NPS calculator.
The formula
NPS asks one question: how likely are you to recommend us to a friend or colleague? People answer from 0 to 10, and you sort the answers into three groups:
| Group | Answers |
|---|---|
| Promoters | 9 or 10 |
| Passives | 7 or 8 |
| Detractors | 0 to 6 |
Then:
NPS = % promoters - % detractors
Contentsquare states it the same way. 1 It also notes that passives are not directly part of the calculation.
An equivalent form is (promoters - detractors) divided by total answers, times 100.
Example 1: ten answers, one by one
A shop called Birchwood Books sends the question to ten customers. The answers, made up, are:
10, 9, 9, 8, 7, 10, 6, 3, 9, 8
Step 1: sort them.
- Promoters (9 or 10): 10, 9, 9, 10, 9. That is 5 answers.
- Passives (7 or 8): 8, 7, 8. That is 3 answers.
- Detractors (0 to 6): 6, 3. That is 2 answers.
Check: 5 + 3 + 2 = 10, so every answer is in a group.
Step 2: turn counts into percentages. Promoters: 5 out of 10 is 50%. Detractors: 2 out of 10 is 20%.
Step 3: subtract. 50 - 20 = 30. The NPS is 30, or +30.
The three passives are in the total of 10, which is why 5 promoters make 50% and not 62.5%.
Example 2: 64 answers and rounding
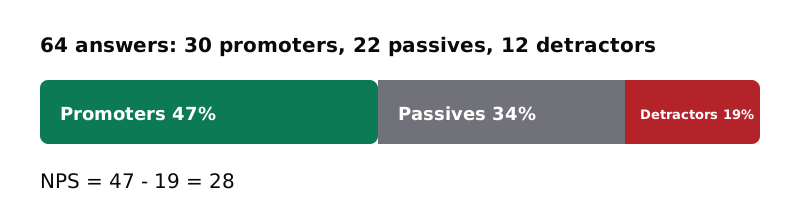
Real surveys rarely divide so neatly. Say Larkspur Studio gets 64 answers (made up):
| Group | Answers | Share of 64 |
|---|---|---|
| Promoters (9 to 10) | 30 | 46.875% |
| Passives (7 to 8) | 22 | 34.375% |
| Detractors (0 to 6) | 12 | 18.75% |
The three groups add up to 64 (30 + 22 + 12). Then 46.875 - 18.75 = 28.125. NPS is normally a whole number, and here both ways of rounding agree:
- Round the final result: 28.125 rounds to 28.
- Round each share first: 47% - 19% = 28.
The two methods do not always agree. Take 6 answers with 2 promoters, 3 passives and 1 detractor. The exact result is (2 - 1) divided by 6, which is 16.67, so it rounds to 17. Round each share first and 33.33% becomes 33 and 16.67% becomes 17, so the score is 16. The Contentsquare guide rounds each share to two decimal places before it subtracts. Pick one method and use it every time, so your scores stay comparable.
Example 3: a 1 to 5 scale
Some surveys use five points, not eleven. The formula stays the same. Only the grouping changes.
CustomerSure says NPS can use a 1 to 5 scale, and that you choose the mapping. 2 Its simplest suggestion is:
| Answer | Group |
|---|---|
| 4 or 5 | Promoter |
| 3 | Passive |
| 1 or 2 | Detractor |
Say eight customers answer (made up): 5, 4, 4, 3, 2, 5, 1, 4.
- Promoters (4 or 5): 5, 4, 4, 5, 4. That is 5 answers, or 62.5%.
- Passives (3): 1 answer, or 12.5%.
- Detractors (1 or 2): 2, 1. That is 2 answers, or 25%.
The score is 62.5 - 25 = 37.5, or 38 rounded to a whole number.
CustomerSure lists two other mappings: one keeps "promoter" for a 5 only, and one is closer to the usual 0 to 10 proportions. It says consistency matters more than which mapping you choose. It also warns against comparing a 1 to 5 score directly with an older 0 to 10 score, because a different scale changes how people answer. If you switch scales, treat the first result as a new baseline.
Common mistakes
- Leaving passives out of the total. They do not add or subtract, but they are in the count of answers.
- Subtracting counts, not percentages. With 30 promoters and 12 detractors, 18 is not the score. Divide by the total first.
- Putting a 6 in the wrong group. A 6 is a detractor. A 7 is a passive.
- Mixing methods. Round shares one month and the result the next, and your trend line wobbles for no reason.
- Mixing audiences. Calculate customer and employee scores separately. See our guide to running an eNPS survey for the employee version.
How to check your own result
- Add the three counts. The sum must equal the number of answers.
- Each share must be between 0 and 100.
- If everyone is a promoter, the score must be +100. If everyone is a detractor, it must be -100. An even split between the two groups gives 0.
- Run the numbers a second way: (promoters - detractors) divided by total answers, times 100.
Reading the number
A single number tells you little. Compare it with your own past scores, and read the comments behind it. Our guide to what a good NPS score looks like covers the common bands and why they differ by industry. With 20 answers, each answer is worth 5 points, so one person can move the score a lot.
To learn why people gave their scores, add a follow-up.
See 15 NPS follow-up questions for wording you can copy.
Where Pulseri fits
A spreadsheet and the formula above are enough to start. When you send surveys on a schedule, Pulseri does the sorting and the maths, shows the score over time and keeps the comments next to it.
Sources
- How to Calculate Net Promoter Score (Contentsquare) (retrieved 15 Oct 2026) Back to text
- How to Calculate NPS on a 1-to-5 Scale (CustomerSure) (retrieved 15 Oct 2026) Back to text