 Pulseri

A common rule says an NPS above 0 is good and above 50 is excellent. Your own trend matters more than any band: is your score rising, and what do people say when they explain it?
How the score is built
You ask one question: how likely is it that you would recommend the company to a friend or colleague? People answer from 0 to 10. 1
Then you sort the answers into three groups:
- Promoters answered 9 or 10.
- Passives answered 7 or 8.
- Detractors answered 0 to 6.
Your score is the share of promoters minus the share of detractors. Passives count in the total number of answers but not as promoters or detractors. The result runs from -100 to +100.
A worked example
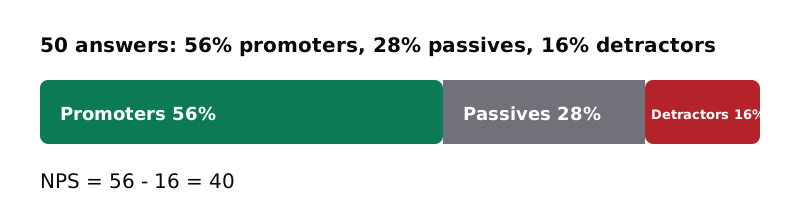
A small team got 50 answers. The numbers are made up.
| Group | Answers | Share |
|---|---|---|
| Promoters (9 to 10) | 28 | 56% |
| Passives (7 to 8) | 14 | 28% |
| Detractors (0 to 6) | 8 | 16% |
The score is 56 minus 16, which is 40.
What the bands mean
Qualtrics describes a framework from Bain & Company that treats any score above 0 as good, above 20 as favorable, above 50 as excellent and above 80 as world-class. 1
| Score | Common label |
|---|---|
| Above 0 | Good |
| Above 20 | Favorable |
| Above 50 | Excellent |
| Above 80 | World-class |
Use the bands as a rough guide to where you stand. A score says what people would do, so check it against what they did, as customer loyalty explains.
Why one number for everyone does not work
Industries differ. Qualtrics cautions that no single score is good in absolute terms. Its 2023 research found an average NPS of 30 for grocery, 29 for video streaming and -6 for consumer payments. 1 A score of 30 is about average in grocery and video streaming, and far above average in consumer payments.
AskNicely says to compare yourself with peers in your own sector, and calls benchmarks "directional guideposts, not absolutes". 2
Use a benchmark only if it comes from a report you can name and check. Otherwise compare yourself with your own past scores.
How to read your own score
- Start with a baseline. Your first score is your starting line, whatever it is.
- Measure the same way each time. Same question, same kind of people, same timing. Any change shifts the score for reasons unrelated to how you are doing.
- Watch the trend. A climb from 12 to 25 over three quarters (made-up numbers) tells you more about progress than a benchmark does.
- Read the comments. The reasons people give show what to fix.
- Look at groups. A fine overall number can hide an unhappy group, such as new customers or one plan.
With 20 answers, each answer is worth 5 points. One person moving from passive to detractor drops your score by 5, and a change that size may be noise. Wait for more answers before you celebrate or worry.
What to do about detractors and passives
Reach out to detractors soon, while they remember what went wrong. A short reply that says you read their comment is enough.
Ask passives what would make them score you a 9 or 10.
Common traps
- Chasing the number. If staff beg customers for a 10, the score can rise while nothing improves.
- Asking too often. People who get asked again and again stop answering. Our guide on asking for feedback without annoying people covers timing.
- Mixing audiences. Customers and employees answer different questions. Keep their scores apart.
- Using NPS for everything. It measures the overall relationship. For a single moment, such as a support chat, see NPS, CSAT or CES.
Where Pulseri fits
Pulseri shows your score over time and the comments behind it, so you can watch the trend instead of one number.
Sources
- Net Promoter Score (Qualtrics) (retrieved 13 Oct 2026) Back to text: 1, 2, 3
- What is a good NPS score (AskNicely) (retrieved 13 Oct 2026) Back to text